Chapter 8 Rmarkdownsyntax
Generate a graph with ggplot (any graph you like, here are some examples) and try some options to make it colourblind-friendly. Test your figure here (Export your graph to jpeg using the export option in Rstudio (bottom right, above the graph) or ggsave() and upload the file to this website.)
library(tidyverse)
library(ggplot2)
# Using median
mpg %>%
  mutate(class = fct_reorder(class, hwy, .fun='median')) %>%
  ggplot( aes(x=reorder(class, hwy), y=hwy, fill=class)) +
    geom_boxplot() +
    xlab("class") +
    theme(legend.position="none") +
    xlab("")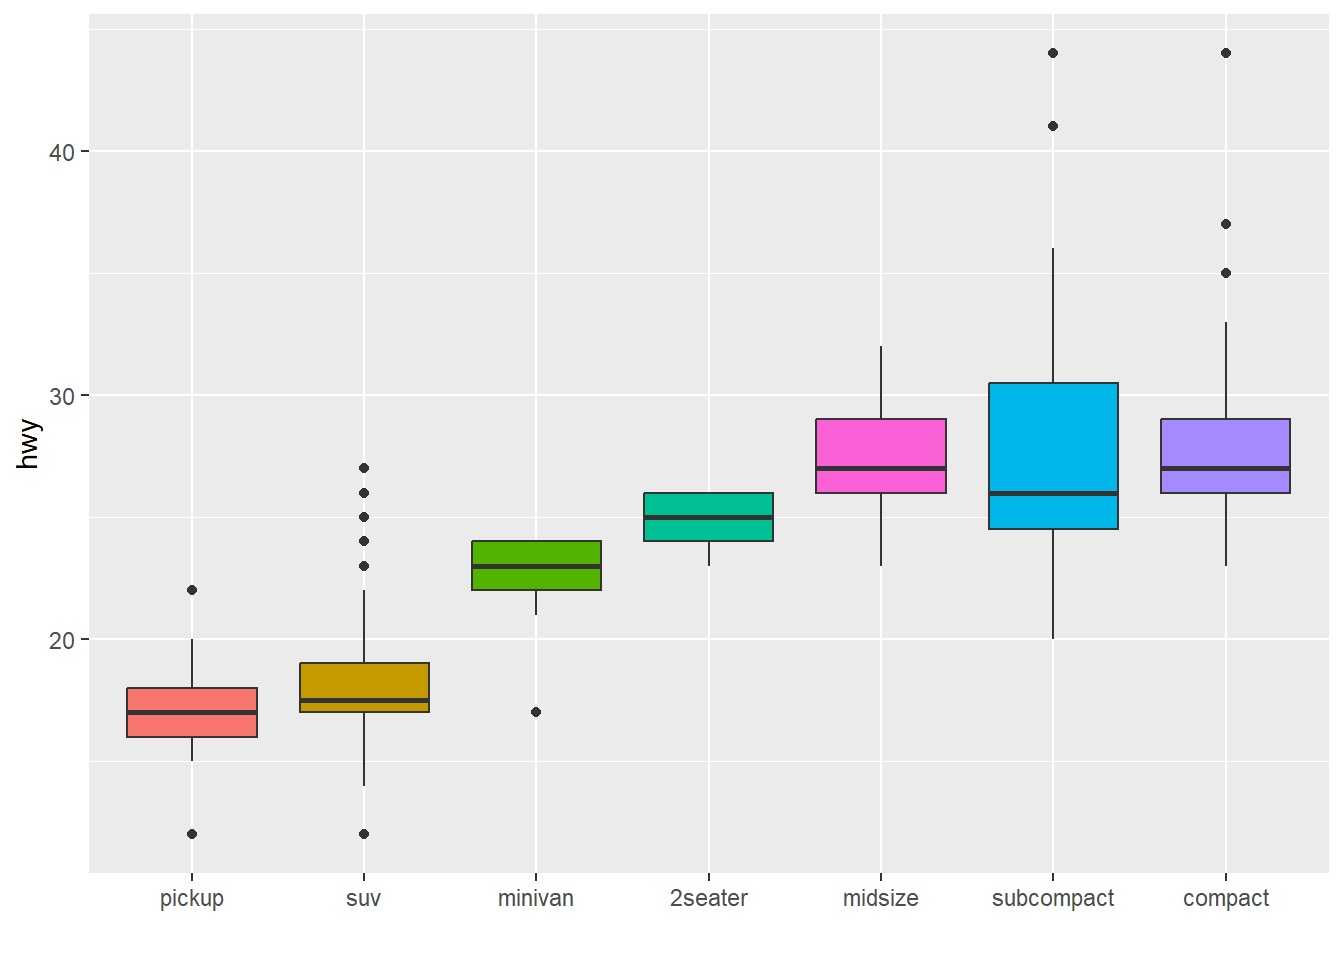
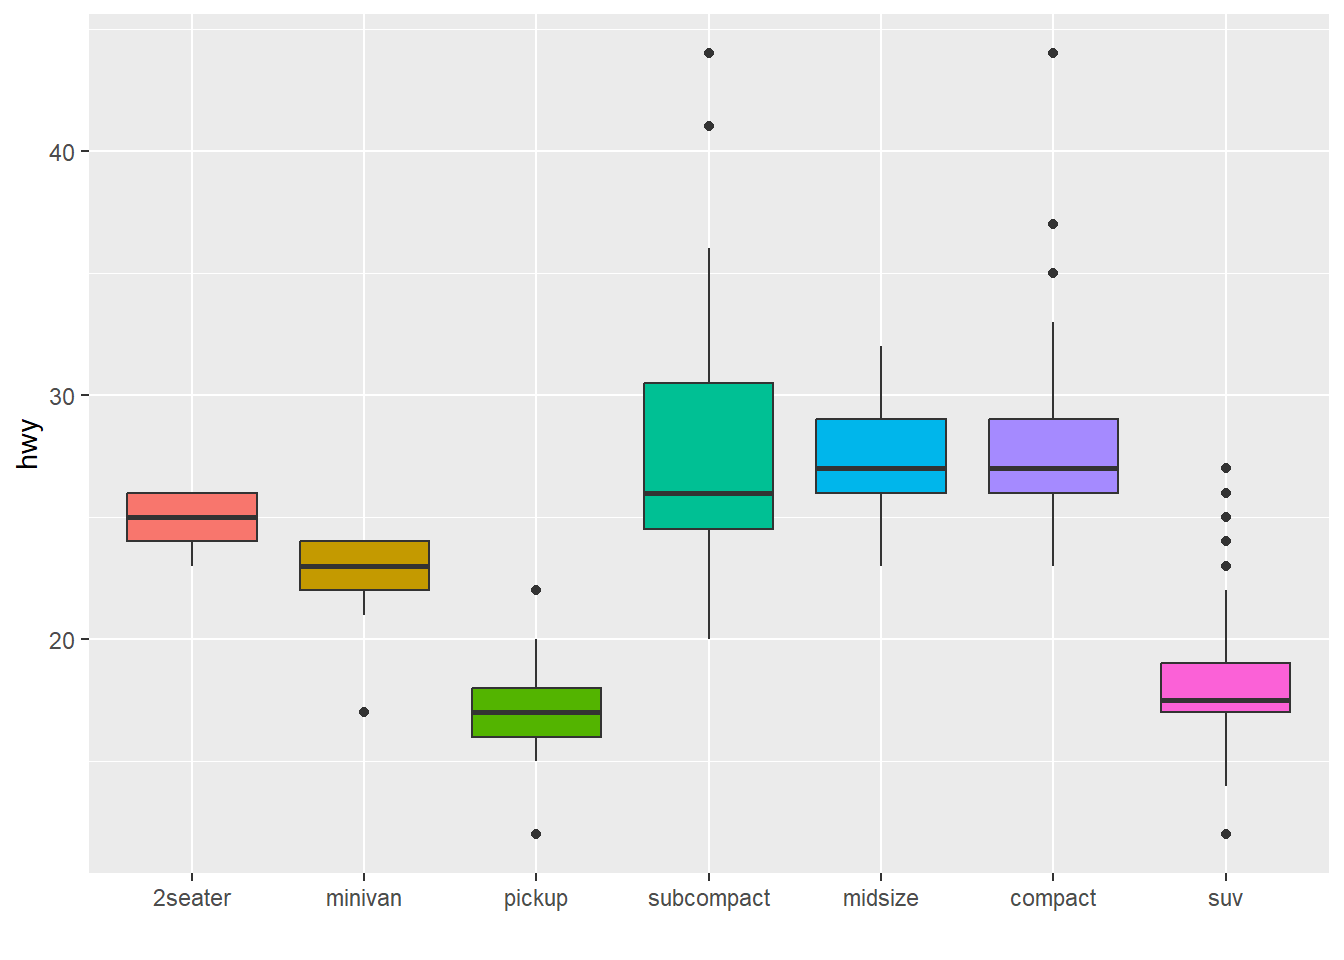
# Using number of observation per group
mpg %>%
  mutate(class = fct_reorder(class, hwy, .fun='length' )) %>%
  ggplot( aes(x=class, y=hwy, fill=class)) +
    geom_boxplot() +
    xlab("class") +
    theme(legend.position="none") +
    xlab("") +
    xlab("")