Reproducible research
# install.packages("devtools") ## if not already installed
devtools::install_github("uashogeschoolutrecht/toolboxr")
## Using GitHub PAT from the git credential store.
## Skipping install of 'toolboxr' from a github remote, the SHA1 (e43ee4ec) has not changed since last install.
##   Use `force = TRUE` to force installation
## load the package
library(toolboxr)
library(ggplot2)
library(tidyverse)
library(nlme)
##
## Attaching package: 'nlme'
## The following object is masked from 'package:dplyr':
##
##     collapse
library(ggsignif)
ergo_model <- lme(
  data = ergoStool, # the data to be used for the model
  fixed = effort ~ Type, # the dependent and fixed effects variables
  random = ~1 | Subject # random intercepts for Subject variable
)
result <- ergo_model %>% summary()
result$tTable %>% as.data.frame() %>% knitr::kable()
| (Intercept) |
8.5555556 |
0.5760123 |
24 |
14.853079 |
0.0000000 |
| TypeT2 |
3.8888889 |
0.5186838 |
24 |
7.497610 |
0.0000001 |
| TypeT3 |
2.2222222 |
0.5186838 |
24 |
4.284348 |
0.0002563 |
| TypeT4 |
0.6666667 |
0.5186838 |
24 |
1.285305 |
0.2109512 |
# install.packages("ggsignif")


ergo_model <- lme(
  data = ergoStool, # the data to be used for the model
  fixed = effort ~ Type, # the dependent and fixed effects variables
  random = ~1 | Subject # random intercepts for Subject variable
)
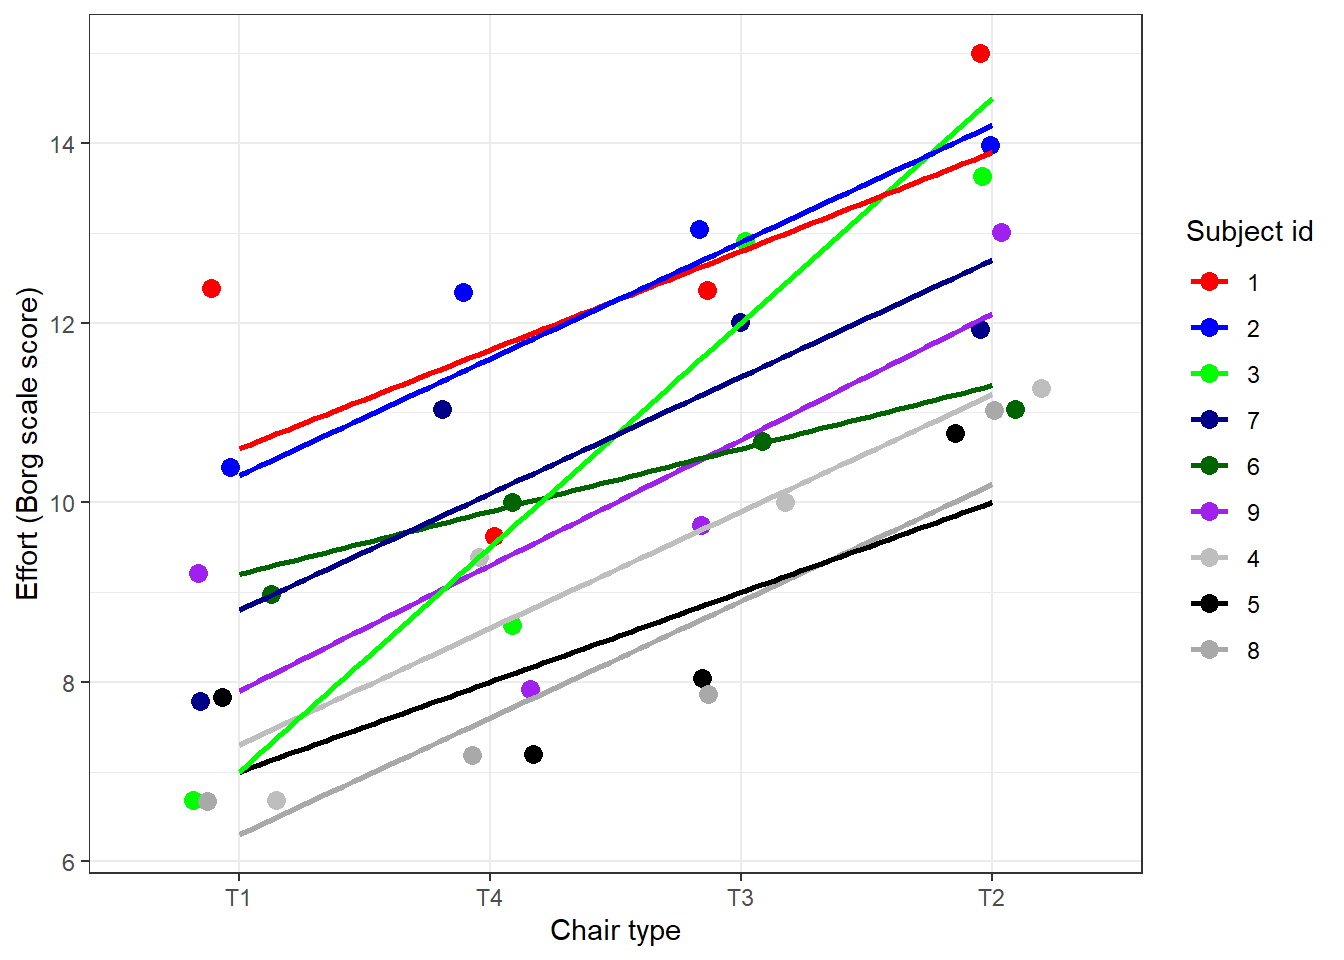
plot_ergo_slopes <- ergoStool %>%
  ggplot(aes(x = reorder(Type, effort), y = effort)) +
  geom_jitter(aes(colour = reorder(Subject, -effort)),
              width = 0.2, size = 3) +
  geom_smooth(aes(group = Subject, colour = Subject), method = "lm", se = FALSE) +
  scale_colour_manual(
    values = c(
      "red","blue",
      "green", "darkblue",
      "darkgreen", "purple",
      "grey", "black", "darkgrey")
    ) +
  ylab("Effort (Borg scale score)") +
  xlab("Chair type") +
  guides(colour=guide_legend(title="Subject id")) +
  theme_bw()
plot_ergo_slopes
## `geom_smooth()` using formula = 'y ~ x'
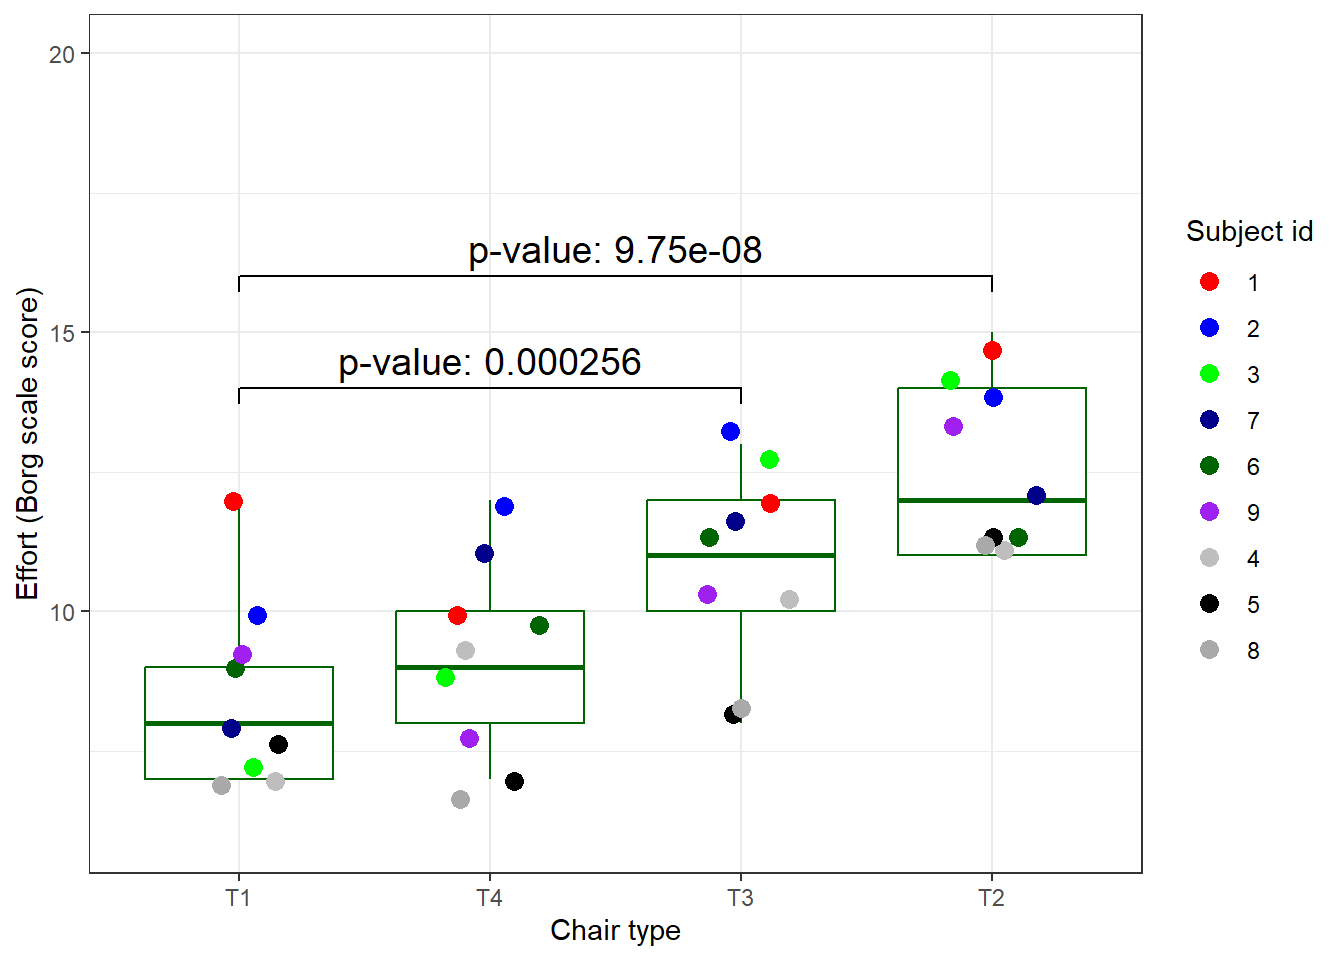
library(ggsignif)
p_values <- result$tTable %>% as.data.frame()
annotation_df <- data.frame(Type=c("T1", "T2"),
                            start=c("T1", "T1"),
                            end=c("T2", "T3"),
                            y=c(16, 14),
                            label=
                              paste("p-value:",
                              c(
                              formatC(
                                p_values$`p-value`[2], digits = 3),
                              formatC(
                                p_values$`p-value`[3], digits = 3)
                              )
                            )
                          )

set.seed(123)
ergoStool %>%
  ggplot(aes(x = reorder(Type, effort),
             y = effort)) +
  geom_boxplot(colour = "darkgreen",
               outlier.shape = NA) +
  geom_jitter(aes(
    colour = reorder(Subject, -effort)),
    width = 0.2,
    size = 3) +
  scale_colour_manual(
    values = c(
      "red", "blue","green",
      "darkblue", "darkgreen",
      "purple", "grey", "black",
      "darkgrey")) +
  ylab("Effort (Borg scale score)") +
  xlab("Chair type") +
  guides(colour=guide_legend(title="Subject id")) +
  ylim(c(6,20)) +
  geom_signif(
    data=annotation_df,
    aes(xmin=start,
    xmax=end,
    annotations=label,
    y_position=y),
    textsize = 5, vjust = -0.2,
    manual=TRUE) +
  theme_bw() -> plot_ergo
## Warning in geom_signif(data = annotation_df, aes(xmin = start, xmax = end, : Ignoring unknown aesthetics: xmin, xmax,
## annotations, and y_position